


Data crunch: In the final instalment of his series analysing findings from the Cost Transparency Initiative, Chris Sier of ClearGlass asks what schemes should actually do with their own data.
Cost data collection is valuable even just as source of analysis, such as this series of articles. But how should schemes actually use their own data?
There is definitely power in just knowing your costs, and almost every scheme has benefited from knowing their total annualised (or sometimes quarterly) costs with a degree of assurance and accuracy they have not previously experienced.
This is great not only for reporting but also for checking. Cost data allow you to validate what you paid a manager against what you might have been expecting to pay, and to challenge your managers accordingly.
The Cost Transparency Initiative framework is designed to do this – it allows investment managers and asset owners to collect and compare costs and charges in a standardised and transparent form. The initiative provides clarity for asset managers about what data to supply, and allows pension schemes and asset owners to compare costs between managers and drive better value for their savers and investors.
Asset management is a data-intensive business. A manager that is bad at data simply has to make you think about whether they are any good at asset management in the first place
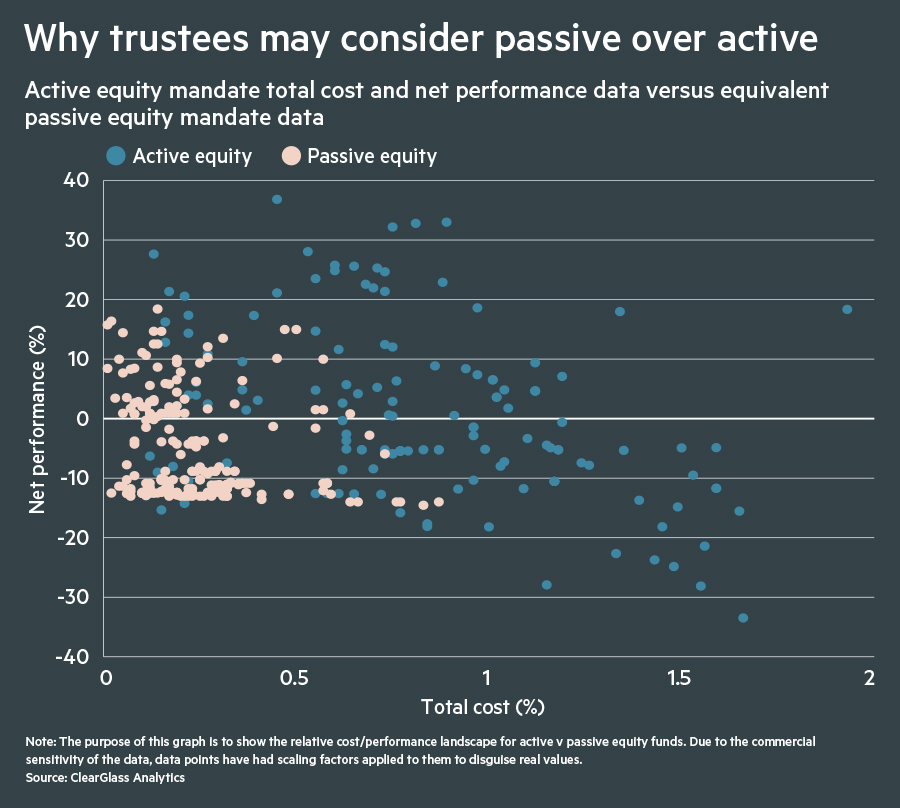
We currently have sufficient data to produce good benchmarks for more than 30 different strategies. Finding out that your manager lies in the ‘low cost, high performance’ quadrant, as opposed to ‘high cost, low performance’ (when compared with an appropriate peer group) is definitely useful for proving value for money and any subsequent VfM reporting.
Proving the VfM of a product is equally valuable for asset managers. The benchmarking is typically used by them for the Assessment of Value framework required by the Financial Conduct Authority.
Managers can also take comfort that the CTI templates are becoming standard and ubiquitous. The efficiency gains of delivering data in the same way each time are considerable, and knowing that your peers and competitors will all be judged by the same yardstick must be satisfying.
What we have learned
- Asset allocation changes as schemes increase in size, with an apparent discontinuity occurring at about £1bn in assets.
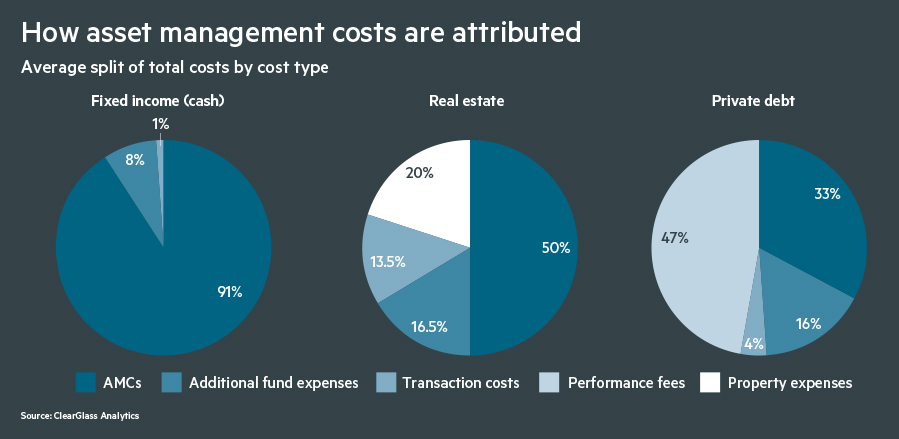
- Different asset classes have different proportions of explicit and implicit costs, and only some attract performance fees. The larger the proportion of assets you have in asset classes with large implicit cost components, the larger the chance you have missed cost data in the past.
- The use of segregated mandates increases as scheme size increases, again with the most dramatic increase occurring within funds with over £1bn AUM.
- The size of mandates increases, and the total number of products used by schemes tails off, as scheme size increases.
- Most asset classes show scale economies at larger sizes of mandate, for both pooled and segregated mandates.
- For almost all asset classes, paying more does not generate higher returns. The exceptions are asset classes that lean towards performance fees and are illiquid.
- Segregated mandates generally incur higher costs, but also generate superior performance.
One hurdle that many schemes will have to overcome is that they might not like what they find out. This is one of the major reasons that schemes demur from the process, and why not all are doing it.
Trustees can be tempted to deny the need for cost collection, proclaiming they already have a handle on fees and rejecting any suggestion they may not know the extent of their costs.
Schemes are sometimes hesitant to admit they have potentially been wrong about their costs and wrong about their manager selections, and the same goes for consultants. But we all have things to learn – the data do not lie.
Another important lesson upstream from finding out your manager is bad VfM is discovering your manager gives shonky or incomplete data, or just refuses point blank. This is the clearest signal you can have that you manager is no good.
There is no excuse for not giving data – or worse, giving wrong data. If the refusal is because a manager does not have the capacity or the systems to supply data, why would you want to have them as your manager?
Asset management is a data-intensive business. A manager that is bad at data simply has to make you think about whether they are any good at asset management in the first place – regardless of your, or your consultant’s, affection for a manager. Do not be pulled into ‘asset manager Stockholm Syndrome’.
What now for the CTI? I decided to get an independent opinion and asked Joe Dabrowski, head of DB, LGPS, and standards at the Pensions and Lifetime Savings Association, what he thought. Broadly, he was happy to see the industry embrace this project and wanted asset owners and consultants to engage further.
“Last year the CTI published its framework of tools and guidance and, more recently, it has now also launched additional resources and is encouraging remaining schemes and asset managers to adopt the standards.
“It’s worth noting that asset managers, pension schemes and their advisers, have already made huge efforts to ensure the CTI framework becomes the industry standard. Three quarters (74 per cent) of respondents to a recent PLSA survey of schemes and consultants said they have a good level of awareness of CTI and the majority have already requested costs information using the CTI templates.
“So far feedback from service providers demonstrates strong levels of take-up of the CTI framework from schemes ranging in size and structure – including DB schemes, LGPS funds and pools and DC master trusts – and we expect awareness to increase further as we move through this year’s cycle of reporting periods.
“We will be exploring how to help schemes understand costs more, including considering how we use data from providers such as ClearGlass to do that.”
I hope you got something from the articles over the past few weeks. My own plan is to make the macro-analysis I have been presenting available – updated and on-platform – to all clients. For a wider, non-client audience without platform access, I will produce it as an annually updated ‘state of the nation’ report. I strongly feel this analysis is useful to everyone, including commentators and regulators, so I will publish it each year.
Dr Chris Sier is chair of ClearGlass Analytics and led the FCA’s Institutional Disclosure Working Group