


With live data connections to the dashboards ecosystem just two months away, our series of articles from independent consultant Richard Smith approaches a climax as he explores the last of his nine pensions.
We’ve finally reached the last of my nine pensions: my state pension.
One of the most exciting things about pensions dashboards is that the first pension shown, in the list of all your pensions, is your state pension. That’s because, for nearly all of us, the state pension matters.
You can already log in online to see your state pension on its own today. What dashboards do, though, is show your state pension forecast alongside all your other workplace and personal pensions so you can see the totality of the estimated income you might get in retirement. It’s great!
Let’s explore my own state pension forecast to illustrate how state pension might be displayed on dashboards, and to think about consumer reactions.
Pension 9: The state pension
How much is the new state pension exactly?
The government’s benefit rates policy paper from November tells us that, currently, the full rate of the new state pension is £221.20 a week. Then, from next month, April 2025, it will increase by about 4.1%, as a result of the much-discussed ‘triple lock’, to £230.25 a week. The MoneyHelper website explains that, to get this full amount, you usually need to have at least 35 years of qualifying National Insurance contributions, although there are some caveats to this.
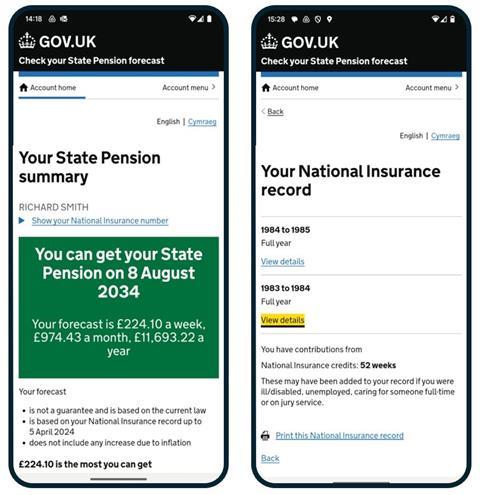
You can see how many qualifying years you’ve got on the National Insurance record page of the excellent government online service: Check your State Pension forecast. Mine is on the right-hand screenshot below.
It’s nice to see (although it makes me feel incredibly old!) that I have a “full year” every year from 1983-84, when I was 16, right through to 2023-24. There’s just one gap in that 41-year period, in 2014/15 after Heather died, when I had a career break to look after the kids.
So, my 40 qualifying years mean I’m very lucky to qualify to receive the full amount of the new state pension from my state pension age. I’ve shown it on the left-hand screenshot below, in the big green box.
Legacy issues: ‘starting amount’ and ‘contracting out’
Hang on a minute. The green box says I’m forecast to receive £224.10 a week, which is a bit higher than the standard £221.20 figure. What’s going on?
I asked the Department for Work and Pensions (DWP) about this, and a spokesperson told me: “This is probably because you had built up an amount of additional state pension under the previous state pension rules. This is carried forward into your starting amount for the new state pension.”
Also, the defined benefit (DB) pension schemes in which I was an active member in the 1980s and 1990s were contracted out of the state earnings-related pension scheme (SERPS), meaning I was in contracted-out employment.
On this, the DWP said: “State pension forecasts take into account periods of contracting out. The exact messages to be shown on dashboards are being finalised, but contracting out information is already available on GOV.UK.”
These are just two of the many, many complexities surrounding the amount of state pension you’ll actually get, depending on your individual circumstances. See Your State Pension explained for more.
This is why it’s so good you’ll see your own particular state pension forecast on pensions dashboards.
Weekly versus monthly
Do you think about your regular expenditure in weekly terms? I tend to know roughly how much I spend a month, but not a week. All state benefits, however, are driven from a core weekly amount.
To arrive at a (perhaps more helpful) monthly amount of state pension, some maths is required.
My state pension above is £224.10 a week, or £32.01 a day. You then have to multiply this daily amount by 365.25 (to account for leap years), making my yearly figure £11,693.22 a year. Then a twelfth of this is £974.43 a month, although state pension is actually paid four-weekly, 13 times a year.
Next month (April 2025) marks a major milestone for the state pension in this country, with the triple lock policy finally increasing the full amount of the new state pension to just over £1,000 a month.
To get this: £230.25 a week, divided by seven, then multiplied by 365.25, is £12,014.12 a year, or £1,001.18 a month.
Getting the state pension on dashboards
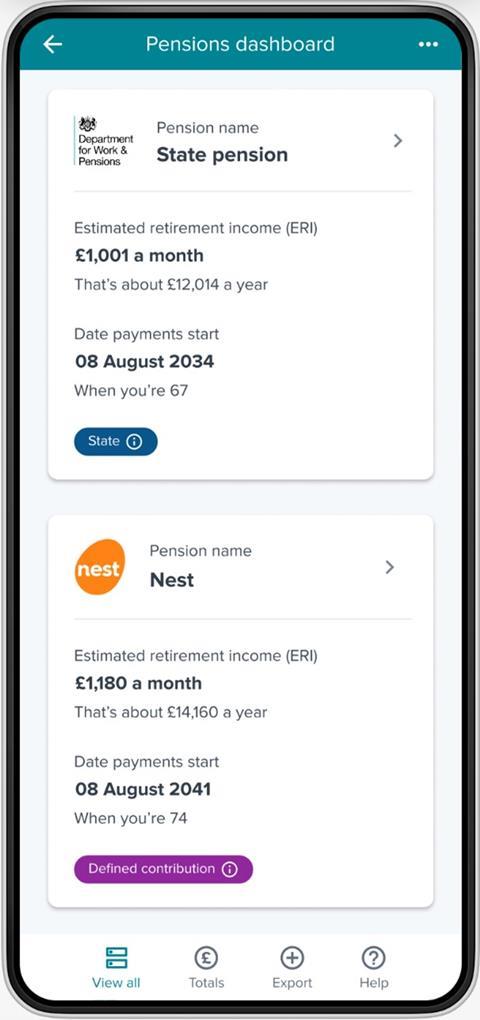
Below is how the 2025-26 state pension might look on a dashboard, on the mandatory initial “Summary List” page, with my Nest pension (from Episode #1 back in August) below it.
How might consumers react?
One thing many in industry don’t yet fully understand about pensions dashboards regulated by the Financial Conduct Authority (FCA) is that they have to be very extensively tested with consumers before they can (a) undergo their statutory independent compliance audits, and (b) receive FCA permission to operate as a live dashboard.
Because of this, leading firms have already done lots of consumer testing of their nascent dashboards. I was lucky to witness some of Moneyhub’s testing with dozens of consumers in 2023.
The vast majority of test participants had no idea they might receive a ‘grand’ a month from the state pension – most thought it would be a lot less. They were excited to see this amount of state pension listed first, and this gave them optimism to scroll down to explore their other workplace and personal pensions.
“A grand a month” really is something. You don’t “buy” your state pension of course, but if you did, MoneyHelper’s annuity comparison tool shows that, currently, to buy an RPI inflation-proofed, single-life annuity, of £1,001 a month, from age 67, you’d need a defined contribution (DC) pension pot of £237,204. That’s a lot, right?
Increasing awareness through dashboards
If state pension is so good, how come so many people – according to Moneyhub’s testing evidence at least – are so ignorant of it?
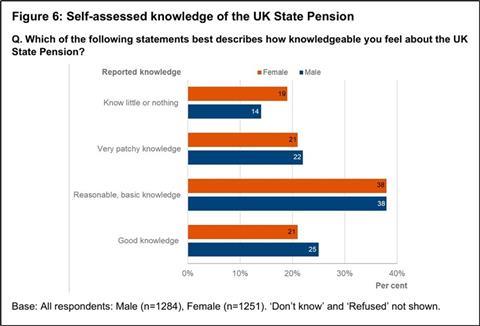
Knowledge varies considerably by age. DWP research published in 2024, which surveyed 2,500 people aged 54 to 64, found that 61% said they had either a “good” (23%) or a “reasonable” (38%) knowledge of the state pension. Men were slightly more confident than women.
It’s this older cohort who are the people most using DWP’s “Check your state pension forecast” online service today.
The DWP’s spokesperson told me that over six million people checked their state pension online in the 10 months from April 2024 to January 2025. So, between seven and eight million a year, which is roughly 20% of the UK’s over 40 million working age adults (assuming these are unique users).
I’ve just received the 2024 usage statistics from Norway, where they’ve had private sector dashboards for a decade through, for example, banking and pension apps.
During 2024, Norwegian citizens requested to see all their pensions data together, on their favourite app, nearly 35 million times. That’s from a working age population of around 3.6 million.
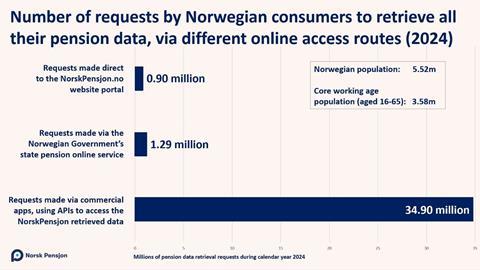
That could be either the entire population looking 10 times a year, or half looking 20 times a year.
What FCA-regulated pensions dashboards achieve, because they’re on familiar apps that people already trust and use frequently, is much wider awareness of the state pension.
And with many more people understanding this core ‘building block’ of retirement income that state pension provides, millions will be sufficiently encouraged to explore their other pensions on top.
Given this usage, it’s great that all the government agencies involved – working with KPMG – have started planning for the introduction of FCA-regulated dashboards to follow after the MoneyHelper pensions dashboard is established.
Consumer testing from this summer
The Money and Pensions Service’s team demonstrated the current version of the MoneyHelper dashboard at an online Connection Forum event on 17 February.
The plan is to start testing the MoneyHelper dashboard with real consumers from this summer, once the first live data is connected at the end of April. The DWP’s spokesperson confirmed to me that state pension is expected to be connected and available to help facilitate this initial citizen testing.
The MoneyHelper team aims to provide more details of the testing plan and timings in the coming weeks.
Next month: the series finale!
Huge thanks, dear readers, for staying with me as I’ve surveyed all nine of my pensions since August.
In episode nine, I’ll bring together the estimated retirement incomes (ERI) from all the previous episodes to reveal what my total ERI might be.
For most consumers, the total ERI really is the nirvana. It’s the one (and often only) thing that the vast majority of people want to know about their pensions and retirement.
This is why a monthly or yearly total estimated retirement income is shown on the home or landing page of all five of the continental pensions dashboards that I saw on my independent research tour in 2023.
You can see how total income is displayed on all these dashboards in a short highlights video here.
Seeing their total ERI helps answer most users’ key question: “Will I be OK when I’m older?”
Many consumers don’t know that 8% statutory minimum contributions aren’t enough to generate what they would consider an adequate pension, so the total ERI they see could shock them.
I’ll say more about that, and the many ways that only FCA-regulated dashboards can help, in the series finale.
Richard Smith is an independent consultant and voluntary chair of the Pensions Dashboards Operators Coalition.
Dashboards Nine-Nine: How Nest is preparing for connection day

With nine months to go to the first dashboards connection deadline, independent pensions dashboards consultant Richard Smith presents the first in a series of profiles exploring how firms are preparing.
- 1
- 2
- 3
- 4
- 5
- 6
- 7
 Currently
reading
Currently
reading
Dashboards Nine-Nine: Connecting the state pension
- 9